


Automated data analysis
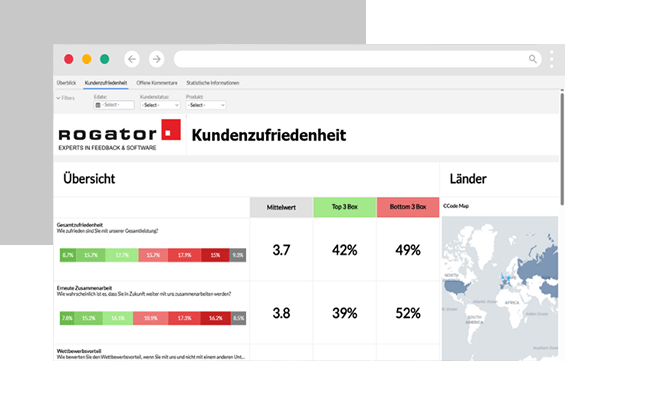
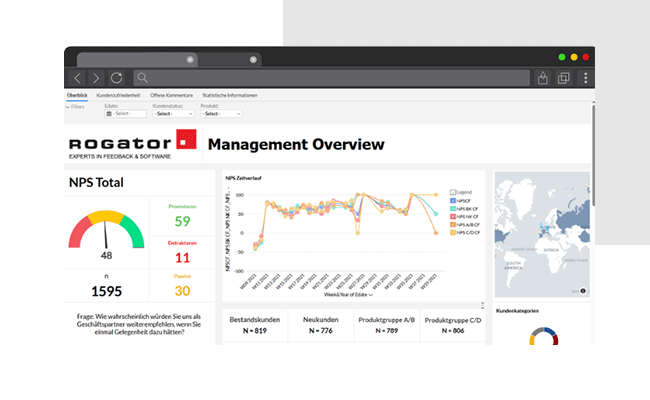
With our Premium Dashboard you have the possibility to clearly visualize and continuously monitor key performance indicators (KPIs). Extensive display and analysis options make decision-making considerably easier, as there is no need for time-consuming calculation of key figures.
A large number of interactive filter options allows you to view specific results in detail and thus identify dependencies and drivers. Time series comparisons allow you to quickly identify specific patterns and trends. These results are then displayed in your Corporate Design using our professional dashboard.
